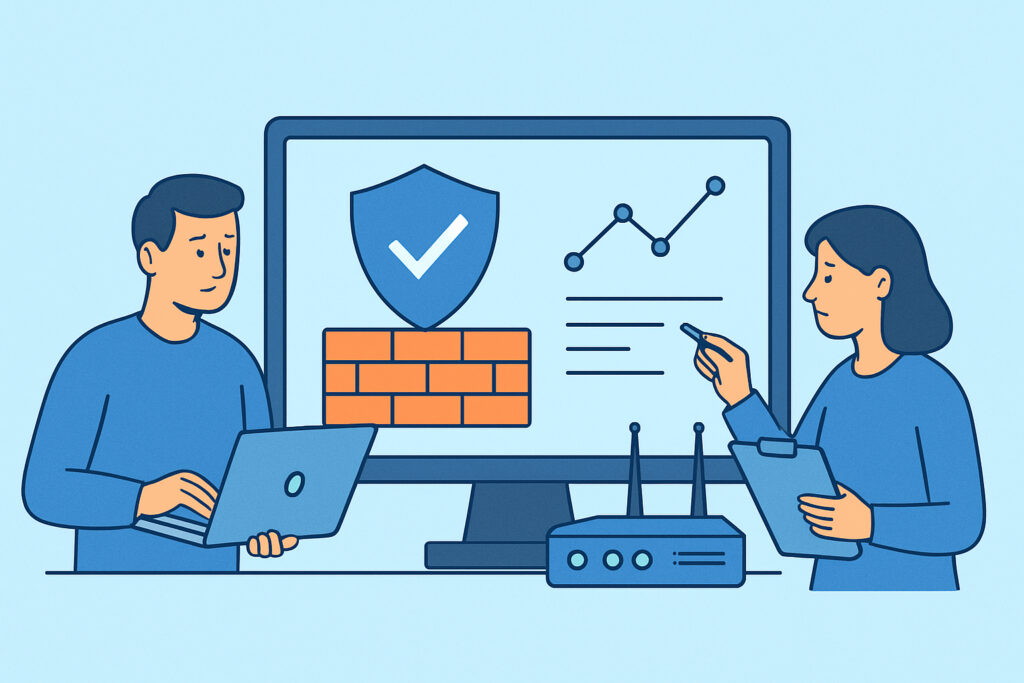
Firewalls and other security appliances sit at the busiest, most consequential chokepoint in the network, yet they’re often the least monitored piece of infrastructure until something breaks – and by then it’s usually an outage or a breach, not a routine metric review. Firewall and security appliance monitoring means tracking the health, throughput, session state, and rule behavior of these devices continuously, not just checking whether the management interface responds to a ping.
Why firewall monitoring gets skipped
Most teams monitor servers and applications religiously but treat the firewall as a black box that “just works.” Part of this comes from access – security appliances are often locked down by a separate team, and general IT staff don’t have SNMP or API credentials to poll them. Part of it is fear of touching a production security device at all.
The result is a blind spot. A firewall silently dropping legitimate traffic because a session table filled up looks identical, from the application team’s perspective, to a flaky upstream ISP. Nobody checks the firewall first because nobody’s watching it.
What actually needs tracking on a firewall
A few metrics matter far more than people assume:
CPU and memory utilization – firewalls doing deep packet inspection or SSL decryption can spike hard under load, and sustained high CPU degrades throughput before it causes an outright failure.
Session/connection table usage – this is the one that bites people most often. Every firewall has a maximum concurrent session count, and when it’s hit, new connections get silently dropped. This looks like random application failures, not a firewall problem, which is exactly why it goes undiagnosed for so long.
Interface throughput and errors – a firewall interface running near capacity, or showing CRC errors and discards, will introduce latency and packet loss that ripples into every service behind it.
VPN tunnel status – for appliances handling site-to-site or remote access VPNs, tunnel up/down state and negotiation failures need real-time alerting, not a daily check.
Rule hit counts and policy changes – tracking which rules are actually being matched helps catch both misconfigurations and unauthorized changes.
Failover and HA state – in an active/passive pair, silent failover (or failed failover) is one of the most common causes of “it worked yesterday” incidents.
A scenario worth knowing
Picture a mid-sized company running a pair of firewalls in an active/passive HA setup. One Friday afternoon, the primary unit’s session table quietly fills up during a marketing campaign traffic spike. New connections start getting dropped, but existing sessions keep working fine, so the helpdesk gets scattered reports of “the site is slow for some people” rather than a clean outage signal.
Nobody thinks to check the firewall because the interface is up, the device responds to ping, and the dashboard – if there even is one – only shows basic reachability. It takes almost three hours of application-team troubleshooting before someone finally pulls the session count and finds it pinned at the max. A quick capacity increase and a rule cleanup fix it, but three hours of degraded service for a problem that a threshold alert would have caught in minutes is a rough way to learn the lesson.
Setting up monitoring without breaking anything
Most enterprise-grade firewalls (Palo Alto, Fortinet, Cisco ASA/Firepower, pfSense, Check Point) expose metrics through SNMP, and many also offer a REST API for more granular polling. A few practical steps:
Start read-only. Use SNMP v2c or v3 with a read-only community string or credential scoped to monitoring only – never give a monitoring tool write access to a security appliance.
Poll on a reasonable interval. Session tables and throughput change fast, so a 60-second poll interval is usually the right balance between responsiveness and load on the management plane. Polling every 5 seconds on an older appliance can itself cause CPU spikes.
Separate management traffic. Where possible, put monitoring polls on an out-of-band management interface rather than the data path, so a saturated firewall doesn’t also lose its own telemetry right when you need it most.
Correlate with logs. Metrics tell you something is wrong; syslog and rule-hit data tell you why. Pulling both into the same view speeds up root cause analysis significantly compared to jumping between two separate tools.
For devices that don’t support a lightweight agent, SNMP-based polling remains the standard approach for pulling CPU, memory, interface, and session metrics without installing anything on the appliance itself.
Busting the “firewall logs are enough” myth
A common misconception is that firewall logs alone are sufficient for operational awareness. Logs tell you about individual connection events and rule matches, but they don’t tell you the device is approaching its session ceiling, running hot on CPU, or that a HA failover just silently happened. Logs are reactive and event-based; capacity and health trends require metric polling over time. Teams that rely purely on log review tend to catch problems only after users complain, because nobody’s watching for the slow creep toward a resource ceiling.
Alerting without the noise
Security appliances generate a lot of chatter – blocked connection attempts, IDS/IPS signature hits, routine rule matches. If every one of these fires a notification, the team will tune out alerts entirely within a week, which is more dangerous than having no alerts at all. Focus alerting on state changes and threshold breaches that actually require action: session table above 80%, interface errors climbing, VPN tunnel down, HA failover triggered, CPU sustained above a defined baseline for several minutes. SNMP trap monitoring is particularly useful here for catching event-driven conditions like link state changes or hardware faults the moment they happen, rather than waiting for the next poll cycle. Pairing that with sensible alert thresholds keeps the signal-to-noise ratio high enough that people actually respond when something fires.
FAQ
Can SNMP polling slow down or destabilize a firewall?
On modern appliances, read-only SNMP polling at a 60-second interval has negligible impact. Older or resource-constrained devices can show CPU bumps under aggressive polling, so start conservative and adjust based on observed load.
Should firewall monitoring be handled by the network team or the security team?
Ideally both have visibility, with security owning rule and policy changes and network/ops owning capacity and availability metrics. Siloed access is exactly what creates blind spots like the session-table scenario above.
What’s the single most overlooked firewall metric?
Session or connection table utilization. It’s rarely on default dashboards, yet it’s one of the most common causes of intermittent, hard-to-diagnose outages.
Firewalls and security appliances deserve the same operational discipline as any other production system – baseline their normal behavior, alert on meaningful deviations, and correlate metrics with logs when something goes wrong. Treating them as a black box only works until the day it doesn’t.