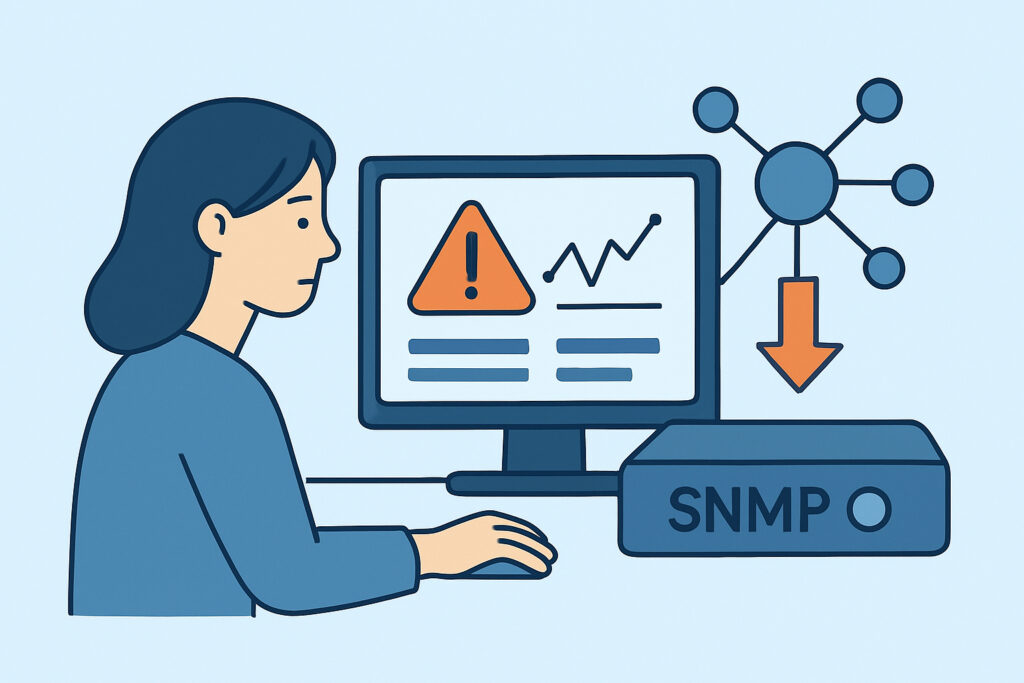
Network devices don’t email you when something breaks – they send SNMP traps, and if nobody’s listening, that failure sits in a log nobody reads until a customer calls. SNMP trap monitoring is how infrastructure teams catch device-level failures, link flaps, and threshold breaches the moment they happen, instead of discovering them during the next scheduled poll or a post-mortem.
This article covers what SNMP traps actually are, how they differ from polling, how to set up trap monitoring correctly, and the mistakes that turn a useful early-warning system into a wall of noise nobody trusts.
What SNMP traps are and why polling alone misses things
SNMP has two ways of getting information out of a device: you ask (polling/GET requests), or the device tells you unprompted (a trap). Polling is great for trend data – interface utilization, CPU load over time – but it only knows what’s happening at the moment you ask. If a switch port flaps up and down for three seconds between polling intervals, a 5-minute poll cycle will never see it.
Traps close that gap. A device – a switch, a UPS, a firewall, a printer, whatever supports SNMP – sends a trap the instant a defined condition occurs: link down, power supply failure, temperature threshold exceeded, authentication failure, cold start after a reboot. The trap arrives as an unsolicited UDP packet (usually port 162) to whatever’s configured as the trap receiver.
The practical difference: polling tells you the state of things right now, traps tell you about events as they happen. A well-designed monitoring setup uses both – this is covered in more depth in a broader comparison of SNMP versus agent-based monitoring approaches.
A scenario that shows why this matters
A UPS in a network closet loses utility power and switches to battery. No one’s polling battery status every ten seconds – that would be wasteful. But the UPS sends an SNMP trap the instant it switches over, and again when battery runs low. Without a trap receiver configured, that event is invisible until the battery drains and everything downstream loses power. With trap monitoring in place, the alert fires within seconds of the switchover, giving the team time to react before it becomes an outage.
The same pattern applies to redundant power supplies failing, fan failures in a chassis switch, or a BGP neighbor going down on a router. These are exactly the kind of events polling-based checks are structurally bad at catching quickly.
Setting up SNMP trap monitoring correctly
Getting traps flowing reliably takes a few deliberate steps, not just pointing devices at a receiver and hoping.
First, configure each device to send traps to your monitoring platform’s IP address, using SNMPv2c with a community string or, preferably, SNMPv3 with authentication and encryption. SNMPv2c traps travel in plaintext, which is a real concern on any network segment you don’t fully control.
Second, load the vendor-specific MIB (Management Information Base) files for your hardware. Without the right MIB, a trap arrives as a stream of numeric OIDs instead of a readable message like “PSU 2 failed” – that’s the difference between an alert someone acts on in seconds and one they have to look up first.
Third, define what happens on receipt. Not every trap deserves a page at 3am. A cold-start trap after a planned maintenance reboot is expected; a cold-start trap on a device nobody scheduled work on is not. Map traps to severity levels before they start arriving, not after the first incident.
Fourth, test it. Trigger a real event – unplug a redundant power supply, disable a port – and confirm the trap arrives, parses correctly, and reaches the right person. Skipping this step is how teams find out their trap receiver has been silently dropping packets for six months.
For the broader context of what’s worth tracking beyond traps on network hardware, see network device monitoring beyond basic ping checks.
The myth: traps mean you don’t need polling
A common misconception is that once trap monitoring is in place, polling becomes redundant. It doesn’t. Traps are unreliable by design – SNMP traps are sent over UDP with no delivery confirmation. If the device is too busy to send it, or a switch drops the packet, or the receiver is momentarily unreachable, that trap is gone forever with no retry.
Polling is the safety net that catches what traps miss. A device that’s completely unreachable can’t send a trap telling you it’s unreachable – that’s precisely the kind of failure only a poll (or a straightforward reachability check) will catch. Treat traps as a fast lane for known events and polling as the baseline truth for state. Relying on traps alone is a gap that eventually shows up as an outage nobody was alerted to.
Avoiding trap flood and alert fatigue
reducing alert fatigue with smarter thresholds and notification rules.Beyond basic traps: what else SNMP gives you
Trap monitoring is one piece of a larger SNMP picture. The same protocol exposes interface counters, environmental sensors on rack hardware, and vendor-specific metrics on switches, firewalls, and UPS units that a generic agent can’t reach. Combining trap-based event capture with scheduled SNMP polling covers both the “something just broke” case and the “this has been degrading for two weeks” case – details on the polling side are covered in the guide to SNMP device monitoring beyond basic server metrics.
Frequently asked questions
What’s the difference between an SNMP trap and an SNMP inform?
An inform is essentially a trap with a delivery confirmation – the receiving system sends an acknowledgment back, and the device retries if it doesn’t get one. Informs are more reliable but use slightly more device and network resources. For critical events, informs are worth the small overhead.
Can SNMP trap monitoring replace a full monitoring platform?
No. Traps tell you about discrete events on devices that support and are configured for SNMP – they don’t cover application performance, disk space, running processes, or anything on a device that isn’t sending traps. Trap monitoring is one input into a broader monitoring setup, not a replacement for it.
Why aren’t my traps showing up in readable form?
This is almost always a missing MIB file. Without the vendor’s MIB loaded on the receiving side, traps display as raw numeric OIDs instead of human-readable descriptions. Check the device vendor’s documentation for the correct MIB package before assuming the trap configuration itself is broken.
Getting SNMP trap monitoring right isn’t about capturing every possible trap – it’s about deciding in advance which events matter, making sure the pipeline delivering them is reliable, and pairing it with polling so nothing falls into the gap between the two. Devices are already telling you when something’s wrong; the job is making sure someone – or something – is actually listening.