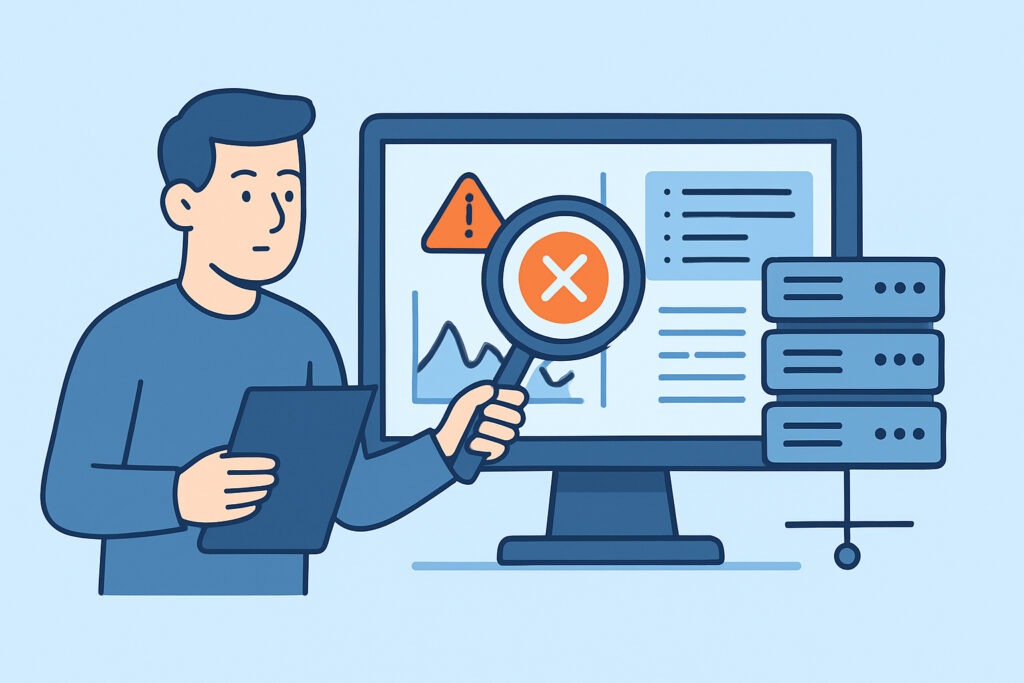
When a server starts throwing errors at 2am, the alert tells you something is wrong – it almost never tells you why. Root cause analysis is the process of digging through monitoring data and logs to find the actual failure point instead of just patching the symptom. This article walks through how to do it methodically, what data sources actually matter, and where most root cause investigations go wrong.
What root cause analysis actually means in practice
Root cause analysis (RCA) is not the same as incident response. Incident response is about restoring service fast – restarting a process, failing over to a replica, rolling back a deploy. RCA happens after (or in parallel with) that, and it’s about answering one question: what condition, change, or failure actually triggered this?
Skipping RCA is how the same outage happens three times in six months. A disk fills up, someone clears logs and moves on, and two months later it fills up again because nobody figured out what was writing 40GB of debug logs a day in the first place.
Why logs alone rarely tell the full story
Logs are a narrative of what an application thought was happening. Metrics are a record of what the system was actually doing. You need both, because logs can lie by omission – an application won’t log “I’m about to run out of memory,” it’ll just log a generic exception right before the OOM killer takes it out.
A common mistake is treating log grep as the whole investigation. Someone searches for ERROR or Exception around the incident timestamp, finds something plausible, and calls it done. Sometimes that log line is a symptom of an upstream resource problem – a database connection timeout because the database host was swapping, not because the application code is broken.
Building a timeline first
Before touching a single log file, establish a timeline using metrics. This is where having historical monitoring data across CPU, memory, disk I/O, and network in one place saves real time, instead of jumping between five different tools with five different retention windows.
Steps that work well in practice:
1. Mark the exact time the alert fired and the time users first reported symptoms – these are often different, and the gap matters.
2. Pull CPU, memory, disk, and network graphs for the affected host(s) starting 30-60 minutes before the alert.
3. Look for the first metric that deviates from its normal pattern, not the most dramatic one. A memory graph climbing steadily for 40 minutes before a spike is a more useful clue than the spike itself.
4. Cross-reference with deploy logs, cron schedules, and backup windows – a huge number of “mystery” incidents line up exactly with a scheduled job.
Knowing what “normal” looks like for a given host or service is what makes step 3 possible at all. Without a baseline, every graph looks alarming or every graph looks fine, depending on the day. This is covered in more depth in Performance Baselines: Know Your Normal to Spot Anomalies, and it’s worth setting up before you’re mid-incident, not during.
Correlating logs with the metric timeline
Once the timeline shows roughly when things started going sideways, that narrow window is where log correlation actually pays off. Pull application logs, system logs (dmesg, journalctl), and any relevant service logs for that specific window – not the whole day.
Things worth checking specifically:
– Kernel logs for OOM killer events, which often get missed because they don’t show up in application logs at all.
– Database slow query logs around the same timestamp – a locked table or a runaway query is a frequent root cause hiding behind a completely unrelated-looking application error.
– Load balancer or reverse proxy logs for a spike in 502/504 responses, which usually points upstream rather than at the proxy itself.
A common misconception worth clearing up
There’s a persistent myth that the root cause is whatever changed most recently before the incident – “we deployed at 3:12, the outage started at 3:15, so it’s the deploy.” Recency is a strong hint, not proof. Plenty of outages are triggered by a slow-building condition (disk filling, memory leak, certificate nearing expiry) that a deploy or a traffic spike simply tips over the edge.
Treating the most recent change as the automatic culprit means real infrastructure issues get missed while a perfectly fine deploy gets rolled back and blamed. Always verify against the metric timeline before assuming causation from proximity in time.
Documenting findings so they’re actually useful later
An RCA that lives in someone’s memory or a Slack thread is functionally the same as no RCA. Write down the timeline, the confirmed root cause, the contributing factors, and – critically – what monitoring gap allowed it to go undetected for as long as it did.
This is also where teams should be tracking how long detection and resolution actually took, since that number tends to shrink noticeably once RCA becomes a habit instead of an afterthought. That process is covered in How to Track and Reduce Mean Time to Recovery. For teams that want a repeatable structure to follow every time, rather than reinventing the process under pressure, Incident Response Playbooks for Infrastructure Monitoring Teams is a useful reference for pairing RCA with a formal response process.
Setting up the right alerts so RCA starts earlier
The best RCA is the one that starts before the outage, because a threshold alert catches the slow-building condition days before it becomes a page. Disk space trending toward full, memory usage climbing without a corresponding drop after garbage collection, connection pools staying saturated longer each day – these are all root causes waiting to happen, and they’re visible well in advance if something is actually watching for the trend, not just the threshold.
Frequently asked questions
How far back should I look when starting a root cause investigation?
Start at least 30-60 minutes before the alert fired, not just at the alert timestamp. Many root causes build gradually, and the actual trigger point is often well before anyone – human or automated – noticed a problem.
Is the most recent deploy always a good first suspect?
It’s a reasonable starting point but not a conclusion on its own. Confirm it against the metrics timeline before assuming a deploy caused an incident, since slow-building resource issues frequently get misattributed to whatever changed most recently.
What’s the single most common mistake in root cause analysis?
Stopping at the first plausible error message instead of tracing it back to an underlying resource or infrastructure condition. A connection timeout, a failed health check, or a generic exception is usually a symptom, not the root cause itself.
Root cause analysis is only as good as the data behind it. A timeline built from real metrics, checked against logs for the right window, and documented afterward turns recurring outages into one-time incidents – which, in the end, is the entire point of doing it.