Pre-selected internal links:
1. /monitoring-strategy-for-hybrid-cloud-infrastructure/ – directly relevant to multi-cloud monitoring strategy
2. /multi-cloud-monitoring-without-multiple-tools/ – directly relevant to the article topic
3. /external-vs-internal-monitoring-why-you-need-both/ – relevant when discussing what cloud monitoring covers vs. misses
—
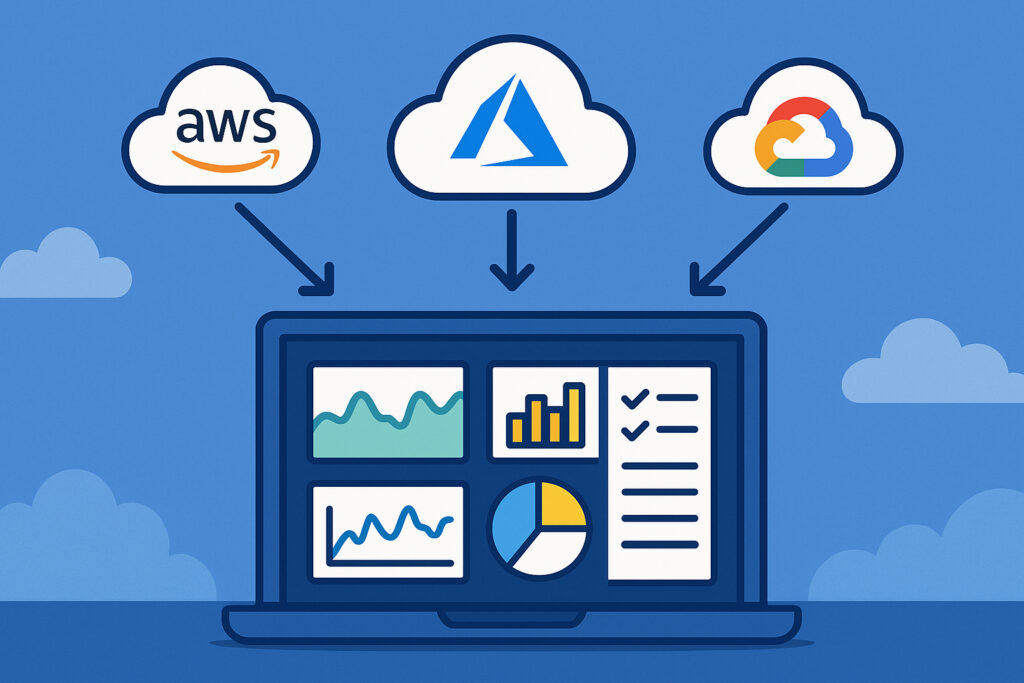
Cloud integration monitoring covers one of the most fragmented problems in modern infrastructure – getting consistent visibility across AWS, Azure, and GCP from a single place. Whether you’re running workloads on a single cloud or spread across all three, the core challenge is the same: each platform speaks a different language, exposes different metrics, and requires different tooling to interpret them properly.
Why Cloud Monitoring Is More Complex Than It Looks
Each major cloud provider has its own native monitoring stack. AWS has CloudWatch, Azure has Monitor, GCP has Cloud Operations (formerly Stackdriver). These tools are excellent within their own ecosystems – but they don’t talk to each other, and they each have their own alert formats, metric naming conventions, and retention policies.
Teams running multi-cloud or hybrid environments end up doing a lot of manual correlation. An engineer gets a CloudWatch alert, then has to log into a separate portal to check if the same issue is affecting Azure-hosted services. That context-switching adds time and increases the chance of missing something.
The deeper problem is that native tools only see what’s inside the cloud boundary. They won’t tell you about a degraded on-prem database that’s causing cascading failures upstream, or a network path issue between your data center and a cloud region. That’s why combining external and internal monitoring perspectives matters more in cloud environments, not less.
What Cloud Integration Actually Monitors
When people talk about AWS, Azure, and GCP monitoring integrations, they usually mean one of two things: pulling metrics from cloud-native APIs, or deploying agents on cloud-hosted VMs. Both have a place.
API-based cloud integrations give you visibility into managed services – things like RDS, S3, Azure SQL, GCP Cloud SQL, load balancers, autoscaling groups. These are resources that don’t have an OS you can access, so an agent isn’t an option. You authenticate via IAM roles or service principals, and the monitoring platform polls the cloud APIs on a schedule.
Agent-based monitoring on cloud VMs gives you deeper insight – CPU steal time, memory pressure, running processes, disk I/O, open connections. Native cloud metrics often miss these. CloudWatch’s EC2 metrics, for example, don’t include memory utilization by default – you have to install the CloudWatch agent or use a third-party agent to get it.
A solid hybrid cloud monitoring strategy typically combines both approaches: API-level visibility into managed services, agent-level visibility into compute instances.
Setting Up Cloud Monitoring: A Practical Walkthrough
The setup process varies slightly per provider, but follows a consistent pattern across AWS, Azure, and GCP.
Step 1 – Create a read-only service account or role. For AWS, create an IAM role with CloudWatch:GetMetricData, EC2:DescribeInstances, and related read permissions. For Azure, create a service principal with the Monitoring Reader role on the relevant subscription. For GCP, create a service account with the Monitoring Viewer role.
Step 2 – Provide credentials to the monitoring platform. This usually means entering an access key pair (AWS), uploading a JSON key file (GCP), or entering a client ID and secret (Azure). The monitoring platform then uses these to authenticate against cloud APIs.
Step 3 – Select the resources to monitor. Choose which regions and resource types to pull metrics from. It’s easy to accidentally enable everything and end up with thousands of metrics you don’t need. Start narrow – focus on the services that are actually in production.
Step 4 – Configure alert thresholds. Cloud APIs return raw metrics. You still need to decide what “bad” looks like – a load balancer with a 5xx error rate above 1%, an RDS instance with CPU above 80% for more than 10 minutes, a GCP instance with disk usage over 90%.
Step 5 – Validate the data. Cross-check a few metrics against what you see in the native cloud consoles. API polling intervals vary, so there may be a 1–5 minute lag. That’s normal.
A Common Misconception About Cloud Monitoring
Many teams assume that because the cloud provider offers native monitoring, they don’t need anything else. This is one of the most persistent myths in infrastructure operations.
Native tools are built to show you what’s happening inside that provider’s platform. They don’t correlate across providers, they don’t cover on-prem or co-lo infrastructure, and they don’t give you a unified incident timeline when a problem spans multiple layers. A database timeout on Azure might actually be caused by a saturated network link between an on-prem application server and the Azure region – native Azure Monitor won’t show you the on-prem side.
Monitoring multi-cloud environments without juggling multiple tools requires a platform that can ingest metrics from all three providers and correlate them in one view. That’s the operational advantage, not just the convenience.
Metrics Worth Prioritizing Across All Three Clouds
Not all cloud metrics are equally useful. Some are informational noise; others are leading indicators of real problems.
Compute (EC2, Azure VMs, GCP Compute Engine): CPU utilization, memory (agent-required), disk I/O, network throughput, and instance status checks. CPU steal time is particularly useful in shared tenancy environments – it indicates the hypervisor is competing for resources.
Databases (RDS, Azure SQL, Cloud SQL): Query latency, active connections, replication lag, free storage, IOPS consumption. Many teams ignore replication lag until a failover event reveals the standby is hours behind.
Load Balancers: Request count, error rates (4xx/5xx), latency percentiles (p95, p99), healthy host count. A sudden drop in healthy hosts is often the first visible sign of a deployment gone wrong.
Object Storage (S3, Azure Blob, GCS): Request error rates and latency. Less commonly monitored, but surprisingly often a factor in application slowdowns.
Frequently Asked Questions
Do I need separate credentials for each cloud provider?
Yes. Each provider has its own IAM system. You’ll need an AWS IAM role, an Azure service principal, and a GCP service account – each with read-only monitoring permissions. The setup is a one-time task per provider and takes about 10–15 minutes.
How often are cloud metrics polled via API?
Most cloud APIs return metrics at 1–5 minute granularity. Some services support 1-minute resolution (standard for EC2 detailed monitoring, for example), while others only offer 5-minute intervals. This is a platform limitation, not a monitoring tool limitation. For faster incident detection on critical services, supplement API metrics with agent-based monitoring on your compute instances.
Can I monitor serverless resources like AWS Lambda or Azure Functions?
Yes, through the cloud APIs. Lambda exposes invocation count, error rate, duration, and throttles via CloudWatch. Azure Functions surface similar metrics through Azure Monitor. These are API-pull metrics only – there’s no OS to install an agent on.
Getting the Most Out of Cloud Monitoring
The biggest practical tip for cloud monitoring: don’t try to monitor everything from day one. Start with the services that generate the most incidents or carry the most risk – typically your databases, load balancers, and application compute instances. Get clean baselines on those, tune your alert thresholds to reduce noise, and expand coverage from there.
Cloud environments also change faster than on-prem ones. New instances spin up, old ones terminate, regions get added. Make sure your monitoring setup handles dynamic resource discovery – otherwise you’ll constantly be manually adding new resources to your dashboards and missing coverage gaps.
The goal isn’t to collect every available metric. It’s to have enough signal to detect a real problem within minutes, understand its scope, and hand off accurate information to whoever is fixing it.