If you’re running workloads across AWS, Azure, and GCP – and juggling three different monitoring dashboards to keep track of it all – you already know the pain. Multi-cloud monitoring without multiple tools isn’t just a nice idea, it’s the difference between spending your mornings fighting context-switching fatigue and actually getting ahead of incidents. This article covers how to consolidate your multi-cloud visibility into a single pane of glass, what metrics matter across providers, and how to avoid the tooling sprawl that quietly eats your budget and your sanity.
The Real Problem With One Tool Per Cloud
Most teams don’t start out planning to run three monitoring platforms. It happens gradually. You launch on AWS and set up CloudWatch. Six months later, a client requirement puts some workloads on Azure, so you add Azure Monitor. Then somebody decides GCP’s pricing works better for a batch processing job, and suddenly you’re logging into yet another console.
Each tool works fine in isolation. The problem is that none of them talk to each other. When something breaks across providers – say a DNS misconfiguration that affects services in two clouds simultaneously – you’re alt-tabbing between dashboards trying to correlate timestamps manually. I’ve seen teams spend 45 minutes on an incident that should have taken 10, simply because they couldn’t see the full picture in one place.
And that’s before you count the cost. Native monitoring tools bill per metric, per alarm, per API call. Across three providers, those charges add up in ways that are surprisingly hard to track.
What a Unified Multi-Cloud Monitoring Stack Looks Like
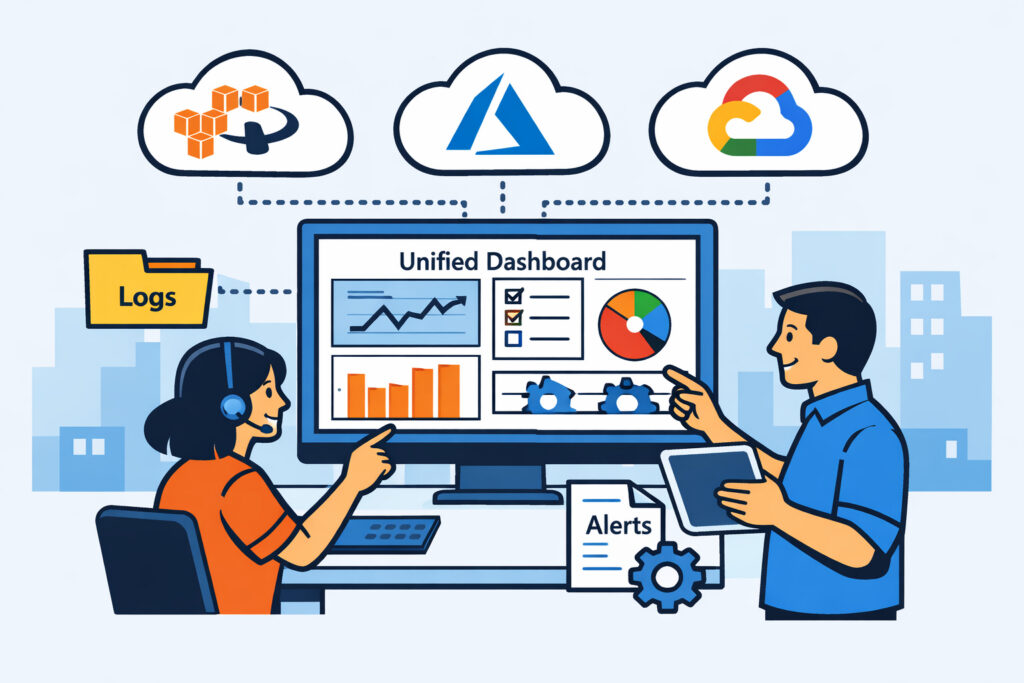
The idea is straightforward: deploy a single lightweight agent on every server regardless of cloud provider, and feed all metrics into one dashboard. CPU, memory, disk, bandwidth, running processes, service health – all of it visible in one view.
NetworkVigil takes exactly this approach. You install the same agent on an EC2 instance, an Azure VM, and a GCP Compute Engine instance. Within minutes, all three appear on your multi-server dashboard with identical metric sets. No provider-specific plugins, no API key juggling, no custom integrations to maintain.
This matters more than it sounds. When every server reports the same metrics in the same format, you can compare performance across clouds directly. Is your Azure VM burning more memory than the equivalent AWS instance running the same workload? You’ll see it immediately.
Step-by-Step: Consolidating Multi-Cloud Monitoring
Here’s a practical path from tooling sprawl to unified visibility:
1. Inventory your current monitoring. List every tool, dashboard, and alert channel you use per cloud provider. Most teams are shocked to find they’re running 4–6 tools when they thought it was two.
2. Define your core metric set. CPU utilization, memory usage, disk I/O, network bandwidth, process counts, and service status cover 90% of what you need day-to-day. Don’t overcomplicate this.
3. Deploy agents across all environments. A good agent installs in under five minutes and uses minimal resources – typically under 50 MB of RAM and negligible CPU. Roll it out to every VM, regardless of provider.
4. Set up a single dashboard. Group servers by environment, function, or cloud provider – whatever makes sense for your team. The key is that everything lives in one place. Custom dashboards let you build views tailored to complex multi-cloud setups without drowning in noise.
5. Consolidate alert routing. One alerting pipeline means one place to tune thresholds, one escalation policy, and one Slack channel (or email, or PagerDuty webhook). No more “which tool sent this alert?” confusion at 2 AM.
6. Decommission redundant tools. Once you’ve verified that your unified stack covers everything, start turning off the per-cloud tools. This is where the real savings kick in.
The Myth of “Cloud-Native Is Always Better”
There’s a persistent belief that you should always use the cloud provider’s own monitoring tools because they have deeper integration. It’s partially true – CloudWatch can trigger auto-scaling groups, Azure Monitor hooks into Azure Automation, and so on. But for observability – knowing what’s happening across your infrastructure – native tools create silos by design.
AWS doesn’t want to make it easy to compare their performance against Azure. That’s not a conspiracy, it’s just not their incentive. An independent monitoring platform has no such bias. It shows you the data as it is, across every provider equally.
You can still keep cloud-native tools for provider-specific automation triggers. But for monitoring and alerting, a single unified platform almost always wins.
Where Cloud Integrations Add Real Value
Beyond agent-based server monitoring, cloud integrations for AWS, Azure, and GCP pull in provider-specific metrics that agents can’t capture – things like managed database performance, serverless function invocations, load balancer health, and storage bucket latency. This gives you the best of both worlds: consistent agent metrics across all VMs, plus cloud-native telemetry for managed services, all in one dashboard.
The trick is filtering. Cloud providers expose hundreds of metrics per service. Nobody needs all of them. Focus on the ones tied to your SLAs – response time, error rates, availability – and ignore the rest.
FAQ
Can I monitor all major cloud providers from a single dashboard?
Yes. By deploying an agent on every server – whether it’s AWS, Azure, or GCP – and using cloud integrations for managed services, you get complete multi-cloud visibility in one place. NetworkVigil supports this out of the box with its free tier covering agent metrics and external monitoring.
Will a unified monitoring tool replace cloud-native monitoring entirely?
For observability and alerting, yes. For cloud-specific automation – like triggering auto-scaling based on CloudWatch alarms – you may still want to keep the native tool for that specific function. But the monitoring and dashboarding layer works better when it’s provider-agnostic.
Does running agents on every cloud provider increase costs significantly?
A lightweight agent typically uses under 50 MB of RAM and minimal CPU. The resource cost is negligible compared to the operational savings from consolidating your monitoring stack – fewer tools to maintain, faster incident response, and reduced per-metric billing from native cloud monitoring.
Final Thought
Multi-cloud is the reality for most teams now, whether by design or by drift. Your monitoring shouldn’t multiply the complexity – it should reduce it. Start by deploying one agent everywhere, build one dashboard, and set up one alert pipeline. You’ll spend less time switching between consoles and more time actually solving problems. That’s the whole point.