External vs internal monitoring is one of those topics where most teams think they’ve got it covered — until something breaks and they realize they were only watching half the picture. If you’re running infrastructure of any size, understanding why you need both external and internal monitoring is the difference between catching problems early and scrambling to explain a two-hour outage to your boss.
Let me break down what each type actually does, where teams go wrong, and how to set up a monitoring strategy that doesn’t leave blind spots.
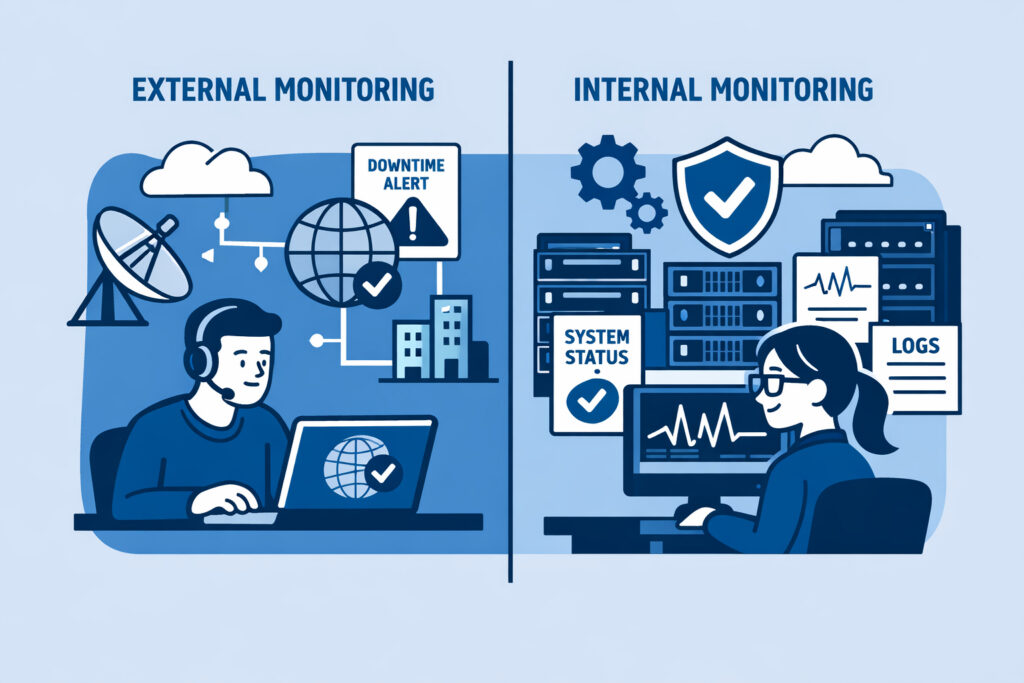
What External Monitoring Actually Covers
External monitoring checks your infrastructure from the outside — the same perspective your users have. It answers a simple question: can someone on the internet reach your services right now?
This includes uptime checks (is the site responding?), SSL certificate validation (is it expiring soon?), port monitoring (are the right services listening?), and DNS resolution. When your external monitor fires an alert, it means real users are likely affected already.
The value here is obvious. Your Nginx process might be running, your server might report 2% CPU usage, and everything looks green on your internal dashboard — but if a misconfigured firewall rule is blocking port 443, none of that matters. External monitoring catches what internal checks physically cannot see.
For the essentials of what to watch from the outside, the guide on SSL certificate and port monitoring covers the critical checkpoints.
What Internal Monitoring Tells You
Internal monitoring — typically agent-based — runs on your servers and reports what’s happening under the hood. CPU load, memory consumption, disk usage trends, running processes, database query times, service states. This is the telemetry that lets you understand why something is going wrong, not just that it’s going wrong.
Here’s a scenario most sysadmins will recognize. It’s Thursday afternoon and your uptime monitor says the website is fine — response times are normal, HTTP 200 across the board. But the agent on your database server shows disk usage climbing from 78% to 91% in two days. You’ve got maybe 36 hours before that volume fills up and writes start failing. Without internal monitoring, you wouldn’t know until users start seeing 500 errors.
A lightweight agent reporting metrics every minute gives you that early warning window. The overhead is negligible. The insight is enormous.
The Myth: “External Monitoring Is Enough”
This is the misconception I hear most often, especially from smaller teams: “We have uptime monitoring, so we’re covered.”
No. Uptime monitoring tells you the patient has a pulse. It doesn’t tell you their blood pressure is dangerously high.
External checks are binary by nature — up or down, reachable or not. They can sometimes detect slow responses, but they can’t tell you that your Redis instance is eating 6 GB of RAM because you forgot to set a maxmemory policy, or that a runaway cron job is pinning two CPU cores every hour. These are the problems that degrade performance for days before causing a full outage. Internal monitoring catches the slow burn.
The flip side is also true, by the way. Running only internal monitoring without external checks means you might miss network-level issues, CDN failures, or DNS problems that are completely invisible from inside your own servers.
How to Combine Both Effectively
The practical approach is layered monitoring. Here’s what that looks like:
Layer 1 — External checks: Uptime monitoring for every public-facing endpoint. SSL expiry tracking. Port availability for critical services (SSH, HTTPS, SMTP, database ports if exposed). DNS record validation. Set alert thresholds tight — if your site takes longer than 3 seconds to respond, you want to know.
Layer 2 — Agent-based internal metrics: Deploy agents on every server. Monitor CPU, memory, disk, and network bandwidth continuously. Track running processes so you spot unexpected services or missing ones. Watch database performance metrics — slow queries, connection counts, replication lag.
Layer 3 — Correlation: This is where real power comes in. When your external monitor detects slow response times, you can immediately cross-reference with internal metrics. Was it a CPU spike? A full disk? A database lock? Instead of guessing, you’re diagnosing.
NetworkVigil handles this by combining external monitoring (uptime, ports, SSL) and agent-based infrastructure metrics in a single dashboard. You don’t need to juggle three different tools and mentally stitch the picture together.
For a deeper look at how these two sides complement each other, the comparison of uptime monitoring vs full infrastructure visibility goes into the nuances.
Setting Up Alerts That Actually Help
Having both monitoring types means nothing if your alerting is misconfigured. I’ve seen setups where teams get 200 emails a day and ignore all of them — which is worse than having no monitoring at all.
The rule of thumb: external alerts should be urgent (something is down or degraded for users right now), while internal alerts should be predictive (something will cause problems if you don’t act). Disk at 90%? That’s a warning. Disk at 98%? That’s critical. CPU spike lasting 30 seconds? Probably fine. CPU above 95% for 15 minutes straight? Time to investigate.
Set escalation tiers. A good guide to getting this right is the overview on real-time alerts for infrastructure issues — it covers thresholds, notification channels, and avoiding alert fatigue.
FAQ
Can I start with just external monitoring and add internal later?
You can, and many teams do. External monitoring gives you immediate value — you’ll know when things go down. But plan to add agent-based monitoring soon after. The longer you wait, the more silent issues accumulate. Most outages I’ve investigated had warning signs in internal metrics days before the actual failure.
Does running a monitoring agent slow down my servers?
A well-designed agent uses minimal resources — typically under 1% CPU and a few megabytes of RAM. The performance impact is effectively zero. The data you get back is worth orders of magnitude more than the resources consumed.
How many tools do I need for complete monitoring coverage?
Ideally, one. The worst monitoring setups are the ones scattered across five different services with no unified view. A platform that combines external checks, agent metrics, and alerting in a single dashboard eliminates the integration headaches and gives you faster incident response.
The Bottom Line
External monitoring shows you what your users experience. Internal monitoring shows you what your servers experience. Running both means you catch outages fast and prevent them from happening in the first place. If you’re currently only doing one or the other, you’ve got a blind spot — and blind spots are where outages hide.