If you’re running more than a handful of servers, you already know what it feels like to juggle SSH sessions, browser tabs, and separate monitoring tools just to get a basic picture of your infrastructure. A multi-server dashboard eliminates that chaos by putting all your critical metrics – CPU, memory, disk, bandwidth, services, and more – into a single unified view. Whether you manage five servers or fifty, this is the difference between reacting to outages and preventing them.
The Real Cost of Fragmented Monitoring
Here’s a scenario most sysadmins will recognize. It’s late evening, and your on-call phone buzzes. Users report slowness on the main web application. You SSH into the app server – looks fine. You check the load balancer – fine. You open another tab for the database server and notice high CPU, but by the time you correlate that with the network metrics from yet another tool, twenty minutes have passed. The root cause? A backup job on the database server was running during peak hours, saturating disk I/O.
With a unified dashboard, you would have seen all of that in about ten seconds. The problem isn’t that sysadmins lack skill – it’s that context switching between tools destroys your ability to spot cross-server patterns.
There’s a common myth that experienced admins don’t need dashboards because they “just know” their servers. That’s nonsense. Nobody can hold the real-time state of twenty servers in their head. Even the best engineer benefits from seeing the whole picture at once. Intuition is great for knowing where to look, but you still need something to look at.
What a Good Multi-Server Dashboard Actually Covers
Not all dashboards are created equal. A useful one covers three layers.
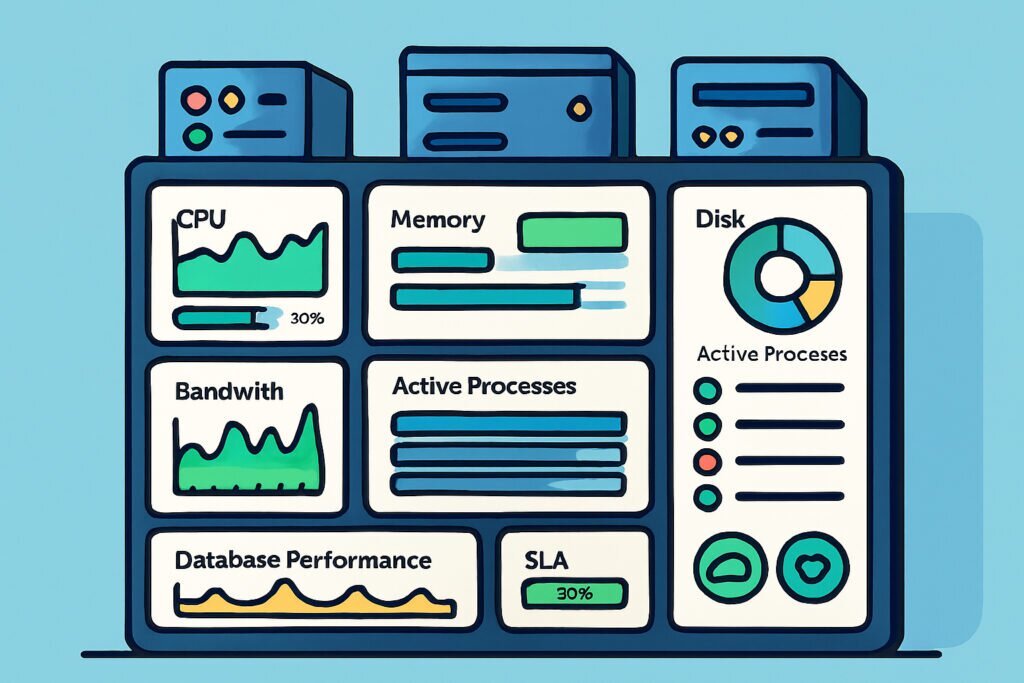
System-level metrics form the foundation. CPU usage, memory consumption, disk space, and network bandwidth across every server, updated in real time. These four numbers catch the majority of common issues. If you want to go deeper, tracking CPU, memory, and disk in real time per server gives you granular insight without information overload.
Service and process health tells you whether the things running on your servers actually work. A server can show healthy system metrics while Apache is segfaulting or a critical cron job stopped running hours ago. Knowing that a server is “up” means nothing if the services on it are broken.
External perspective rounds out the picture. Uptime checks, port monitoring, and SSL certificate status verify that your infrastructure looks healthy from the outside – not just from within your network. Internal metrics and external checks together give you full coverage.
Setting Up a Unified View – The Practical Path
The traditional route involves cobbling together Prometheus, Grafana, node_exporter, Alertmanager, and a reverse proxy in front of everything. If you enjoy spending two days writing YAML configurations, go for it. For everyone else, there’s a simpler approach.
Install a lightweight monitoring agent on each server. The agent collects metrics locally and pushes them to a central dashboard. No inbound firewall rules to configure, no scraping endpoints to expose, no service discovery headaches.
The typical setup looks like this:
1. Sign up for a monitoring account and get your agent token.
2. SSH into each server and run the one-line install command.
3. Wait about 30 seconds for the agent to start reporting.
4. Repeat on the next server.
Five servers take about ten minutes total, including the time to open new terminal tabs. After that, every server appears on your dashboard automatically with all core metrics streaming in.
Reading the Dashboard – What Actually Matters
The biggest rookie mistake is treating a dashboard like a Christmas tree – the more lights, the better. Wrong. A dashboard with 60 panels per server is just noise. Focus on signals.
Relative changes over baselines matter more than absolute numbers. A server normally sitting at 60% CPU that jumps to 90% is far more interesting than a server that always runs at 85%. Know your baselines, watch for deviations.
Cross-server correlation is where dashboards earn their keep. If three web servers spike in CPU simultaneously, you have a traffic surge or a deployment issue. If only one spikes, that server has a specific problem – maybe a runaway process or an uneven load balancer configuration.
Slow trends predict emergencies. Disk usage growing by 1.5 GB per day means you have roughly a month before a 50 GB partition fills up. That’s not urgent today, but it’s critical information for capacity planning. Catching these trends early is something you simply cannot do by SSH-ing into servers individually.
Alerts – Less Is More
A dashboard without real-time alerts is just a pretty picture. But alerts done wrong are worse than no alerts at all.
I’ve worked with setups where the team received 30+ notifications per day. Within a week, everyone was ignoring them. The lesson: alert only on conditions that require human intervention. Disk at 80%? That’s a warning in the dashboard. Disk at 95%? That’s a notification to your phone.
A practical rule – if you wouldn’t cancel dinner to deal with it, it shouldn’t page you. Everything else can be a dashboard indicator that you review during business hours.
Going Beyond the Basics
Once your core monitoring is running, two additions make a noticeable difference.
Database metrics catch problems that system-level monitoring misses entirely. A database server can show normal CPU and memory while replication lag grows or slow queries pile up. Tracking database health metrics alongside system metrics gives you the full story when application performance degrades.
Process-level visibility answers the question “what is actually consuming resources on this server?” without requiring you to SSH in and run top. When a server’s memory spikes, seeing the responsible process directly in the dashboard saves minutes of investigation time.
Frequently Asked Questions
Does a monitoring agent affect server performance?
A properly built agent uses less than 1% CPU and around 50 MB of memory. On any modern server, that’s negligible. If your monitoring agent is consuming noticeable resources, something is misconfigured or you’re using the wrong tool.
Can I monitor servers across different providers and data centers?
Yes – that’s precisely the point. The agent connects outbound to the monitoring platform, so it works regardless of whether your server sits in AWS, Hetzner, a private data center, or your office closet. All of them appear side by side on the same dashboard.
Do I need a separate tool for each type of monitoring?
Not necessarily. Platforms that combine agent-based metrics with external checks – uptime, ports, SSL – give you both internal and external visibility from one place. Running fewer tools means fewer things to maintain and fewer gaps in coverage.
A multi-server dashboard isn’t something you set up once everything else is perfect. It’s what you set up first so that everything else becomes manageable. Start with the basics – system metrics, service health, external checks – and expand only when you have a clear reason. The goal isn’t to monitor everything possible. It’s to see everything that matters, in one view, before your users notice something is wrong.