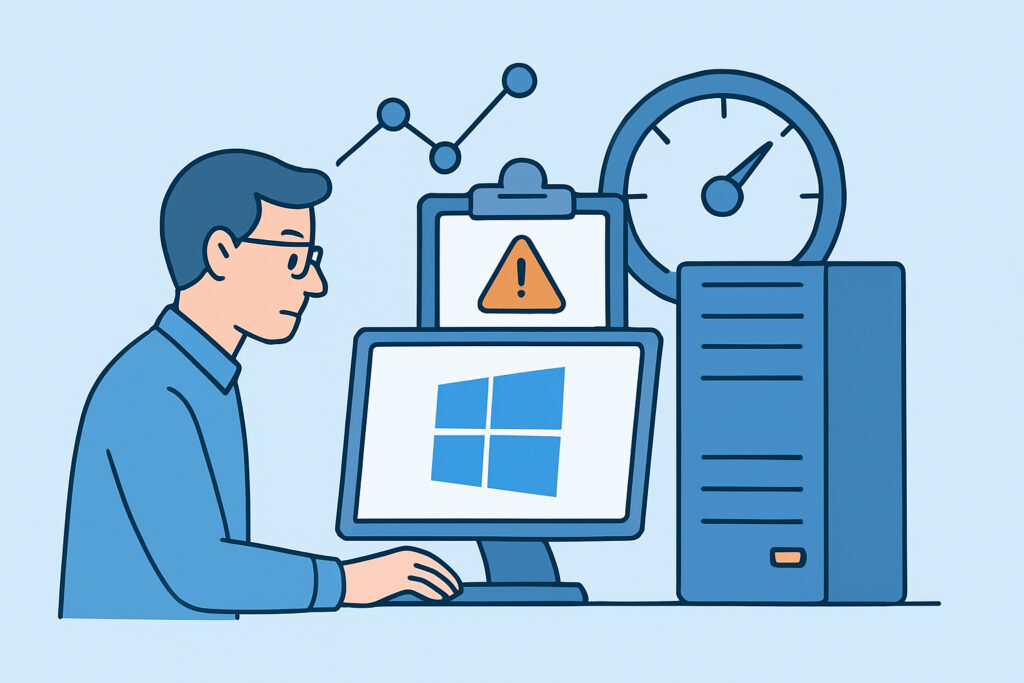
Windows Server monitoring covers more ground than most teams expect – event logs, Windows services, and performance counters each tell a different part of the story, and missing any one of them leaves real blind spots in your infrastructure visibility. Whether you’re managing a handful of servers or a fleet of dozens, pulling these three data sources together is what separates reactive firefighting from actually staying ahead of problems.
Why Windows Server Monitoring Is Different from Linux
Linux admins often assume Windows monitoring works roughly the same way – a few metrics, some log files, done. That assumption causes problems. Windows has its own ecosystem: Event Viewer instead of syslog, Services instead of systemd units, and Performance Monitor instead of /proc. Each has quirks that matter in production.
Event IDs are Windows-specific codes that mean very specific things. Service dependencies create failure chains that don’t exist in the same way on Linux. And performance counters are hierarchical objects with instances – understanding that structure is what makes the data actually useful.
Reading Event Logs Without Drowning in Noise
The Windows Event Log is one of the most information-dense monitoring sources available – and also one of the easiest to ignore because it produces so much output. A typical Windows Server generates thousands of events per hour. The key is filtering down to what matters.
The three channels to watch closely are System, Application, and Security. System logs cover hardware, drivers, and OS-level events. Application logs capture errors from installed software and services. Security logs record authentication events, policy changes, and audit trails.
High-priority Event IDs worth tracking: Event ID 41 (Kernel-Power) flags unexpected shutdowns or power loss. ID 1001 captures Windows Error Reporting crash data. IDs 7034 and 7036 indicate a service crashed or changed state. ID 4625 in the Security log records failed login attempts. ID 6008 marks an unexpected system shutdown.
Don’t monitor every event. Set up filters for Error and Critical severity, then add specific Warning-level Event IDs that matter for your environment. A domain controller has different critical events than a file server or a SQL host.
Service Monitoring: Beyond Just “Is It Running”
Windows Services are the backbone of most server workloads – IIS, SQL Server, Active Directory, RDS, and dozens of custom applications all run as services. The common mistake is only checking whether a service is running. In production, that’s not enough.
Services have startup types (Automatic, Manual, Disabled, Automatic Delayed Start) and recovery actions. A service can be configured to restart on failure, but after three failures it may give up and stay stopped. You won’t see that until something breaks downstream.
What to track beyond running state: service startup type – unexpected changes to Disabled or Manual can indicate unauthorized modifications; service account – changes to which account a service runs under are a security signal; recovery actions – whether and how many times a service has restarted automatically; dependencies – if a dependent service fails, it can cascade silently.
Monitoring service status for critical applications means capturing state changes in real time, not just polling on a fixed interval. A service that crashes and restarts in under 30 seconds will be invisible to a 1-minute polling check.
Performance Counters: The Right Ones, Not All of Them
Performance Monitor gives you access to hundreds of counters across dozens of objects. Collecting all of them is pointless and expensive. The useful set is smaller than most teams think.
CPU: Processor(_Total)% Processor Time is the obvious one. More useful is Processor(_Total)% Privileged Time – high kernel-mode CPU often points to driver issues or disk problems before they become obvious elsewhere. SystemProcessor Queue Length sustained above 2 per CPU core indicates a real bottleneck.
Memory: Available MBytes is the clearest signal. Pages/sec shows paging activity – consistent high values mean the system is swapping. MemoryPool Nonpaged Bytes growing unchecked is a classic memory leak indicator.
Disk: PhysicalDiskAvg. Disk Queue Length is the most important disk counter. Values consistently above 1-2 per spindle indicate I/O saturation. Logical Disk% Free Space handles the capacity side.
Network: Network InterfaceBytes Total/sec compared against the interface’s maximum bandwidth gives you utilization percentage. Packets Received Errors and Packets Outbound Errors flag link-level problems that won’t appear in application logs.
Establish baselines during normal operation before setting alert thresholds. A server that runs at 70% CPU every day isn’t sick – alerting on that threshold will just create noise. Knowing your normal is what makes performance counter alerts actually actionable.
A Common Myth: Event Logs Are Only for Post-Incident Review
Many teams treat Event Logs as a forensics tool – something you dig into after an outage to understand what happened. That framing misses most of their value. Event Logs contain predictive signals: disk warnings before failure (Event ID 7, DISK source), service pre-failure warnings, and driver errors that precede crashes by hours or days.
Setting up real-time monitoring on specific Event IDs, especially from the System and Application channels, turns the Event Log from a post-mortem tool into an early warning system. The data was always there – it just wasn’t being watched.
Agent-Based vs. Agentless Collection on Windows
Windows Server monitoring can be done agentlessly using WMI or WinRM, or with a lightweight agent installed on each server. WMI-based polling works but has limits: it’s polling-only, adds network overhead, and struggles at scale. Agent-based monitoring collects performance counter data locally and streams it with much lower latency – which matters when you’re trying to catch a 30-second service crash window.
For event log monitoring specifically, agents can subscribe to event channels directly, which is far more efficient than polling the log on an interval. Real-time alerting on event log entries requires this kind of push-based collection – polling simply can’t catch transient errors reliably enough.
Frequently Asked Questions
Which Windows Event Log channel should I prioritize for server health monitoring?
The System log is the most important for infrastructure health. It captures hardware errors, driver failures, disk warnings, and unexpected shutdowns. Application and Security logs are critical for application-layer and compliance monitoring, but System events give the clearest picture of server stability.
How often should performance counters be sampled on production servers?
A 60-second interval is sufficient for trend analysis and capacity planning. For catching short-duration spikes – CPU bursts, disk queue saturation – a 10-15 second interval gives meaningfully better visibility. Sampling more frequently than every 10 seconds adds overhead without proportional benefit in most environments.
Can Windows Service monitoring detect a service that crashes and auto-restarts?
Yes, but only if your monitoring captures state-change events rather than just polling current state. Event ID 7034 (service crashed unexpectedly) and 7036 (service state changed) in the System log capture restarts even when the service is back up by the time the next poll runs. Relying only on “is the service running?” will miss these events entirely.
Summary
Windows Server monitoring done well means combining event log filtering, service state tracking, and a focused set of performance counters – not just checking that the server responds to a ping. The most common gaps are treating event logs as read-only history, ignoring service recovery events, and collecting performance counter data without baselines to interpret it. Get those three pieces working together and you’ll catch most Windows Server problems before they escalate into outages.