If you’ve ever watched your server grind to a halt during peak traffic or discovered you’re out of disk space only when your application crashes, you know why real-time monitoring matters. Keeping track of CPU, memory, and disk space isn’t just good practice—it’s essential for preventing downtime, maintaining performance, and catching problems before they escalate into disasters.
Why Real-Time Monitoring Actually Matters
Most administrators I’ve talked to have the same story: they learned about monitoring the hard way. Maybe it was a memory leak that slowly consumed all available RAM over three days, or a log file that grew to fill the entire disk partition. The common thread is that these issues were preventable with proper monitoring.
Real-time monitoring gives you visibility into what’s happening right now, not five minutes ago. When CPU usage spikes to 100%, you need to know immediately so you can investigate whether it’s a legitimate load increase or a runaway process consuming resources. The same applies to memory leaks that can creep up over hours or days, and disk space that can fill up surprisingly quickly when something goes wrong.
Understanding What You’re Actually Monitoring
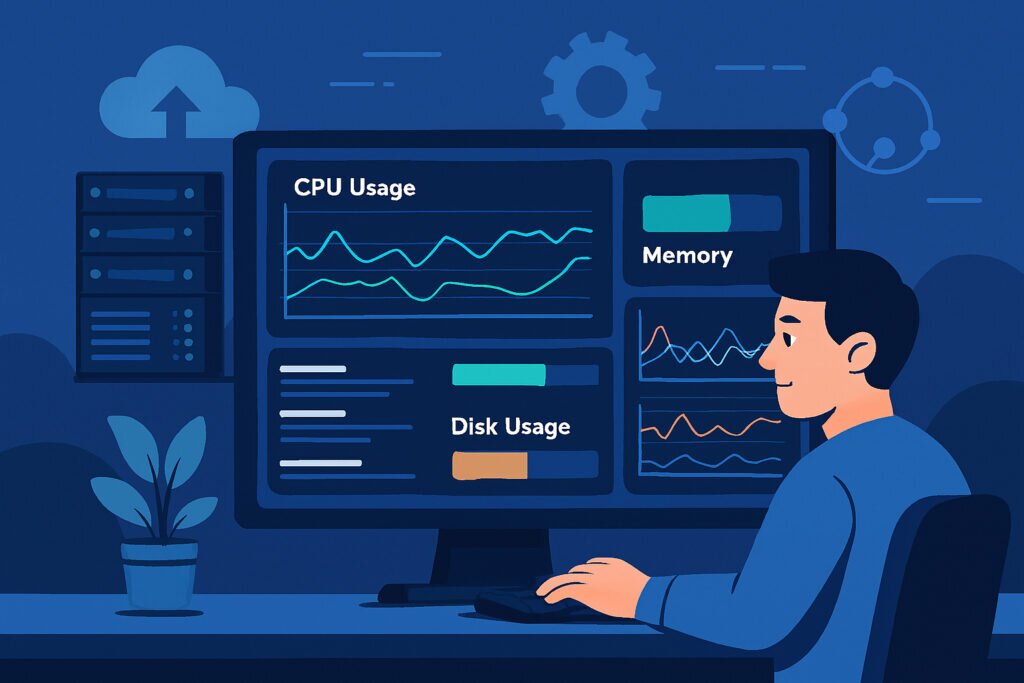
Before diving into tools and commands, it helps to understand what these metrics actually tell you. CPU usage shows how much processing power is being consumed—both overall and per core. A server showing 25% CPU usage on a quad-core system might actually have one core maxed out while the others sit idle, which tells you something about how your application handles threading.
Memory usage is trickier than it appears. Linux systems will use available RAM for caching, which is actually efficient behavior, but it can make memory statistics confusing at first glance. What you really care about is whether you’re swapping to disk, which kills performance.
Disk space seems straightforward until you realize that different partitions can fill at different rates, and that inodes can run out even when you technically have free space. I once spent an hour troubleshooting why a server couldn’t write files, only to discover we’d exhausted inodes despite having 40GB free.
Built-in Tools for Quick Checks
Every Linux system comes with basic monitoring tools that work immediately. The top command gives you a live view of CPU and memory usage along with which processes are consuming resources. Press ”1” to see individual CPU cores and ”M” to sort by memory usage. It’s not fancy, but it works everywhere and requires no setup.
For a more modern alternative, htop provides a color-coded interface that’s easier to read. You can scroll through processes, sort by various metrics, and even kill processes directly from the interface. Most administrators I know prefer htop once they’ve used it—the visual layout just makes more sense.
Checking disk space is as simple as running df -h for a human-readable output showing used and available space per partition. Add du -sh * to identify which directories are consuming the most space when you need to track down space hogs.
Setting Up Continuous Monitoring
Manual checks are fine for troubleshooting, but real monitoring requires automated data collection and alerting. This is where monitoring agents come in. An agent is a small program that runs on your server, collects metrics at regular intervals, and reports them to a central monitoring system.
The installation process is typically straightforward. You install the agent package, configure it to report to your monitoring platform, and start the service. The agent then begins collecting data every few seconds or minutes, depending on your configuration. This gives you historical data showing trends over time, not just snapshots.
What you’re looking for in historical data are patterns. CPU usage that gradually increases over weeks might indicate a memory leak or inefficient code being deployed. Memory usage that spikes every night at 2 AM might correlate with scheduled backup jobs. Disk space that grows linearly suggests you need to plan for expansion or implement log rotation.
Watching Multiple Servers at Once
Once you’re managing more than a couple of servers, logging into each one to check metrics becomes impractical. A centralized dashboard lets you see all your systems in one place. You can spot immediately if one server is struggling while others are fine, which often indicates a specific problem rather than infrastructure-wide load.
The key is having all this information accessible without overwhelming you. Color-coded indicators help—green for normal, yellow for warning thresholds, red for critical issues. You want to glance at your dashboard and immediately know if something needs attention.
Setting Smart Alerts
Alerts are where monitoring becomes proactive rather than reactive. But there’s an art to setting good alert thresholds. Set them too sensitive and you’ll get constant false alarms that you’ll eventually ignore. Set them too loose and you’ll only hear about problems after they’ve caused damage.
For CPU, alerting at 80% for more than five minutes catches actual problems while ignoring brief spikes. Memory alerts should trigger when you’re consistently using 85-90% of available RAM, giving you time to act before the system starts swapping heavily. Disk space alerts at 80% full provide enough warning to clean up or expand storage before running out completely.
Common Mistakes to Avoid
The biggest mistake is not monitoring at all, but the second biggest is monitoring too much. I’ve seen systems with hundreds of metrics being collected, none of them useful. Focus on what actually matters for your specific setup. A web server needs different metrics than a database server.
Another trap is ignoring trends. A server that’s fine today but has been steadily losing free disk space for two months will eventually cause a problem. Trending data helps you be proactive instead of reactive.
Don’t forget about what happens when monitoring itself fails. If your monitoring agent stops reporting, you need to know about that too. Good monitoring systems include heartbeat checks that alert if they stop receiving data from an agent.
Making Monitoring Work for You
Real-time monitoring isn’t about watching graphs all day—it’s about having the information available when you need it and getting alerted when something’s wrong. The goal is to prevent surprises and give yourself time to respond to issues before they become emergencies.
Start simple with the basics: CPU, memory, and disk space on your critical systems. Get comfortable with what normal looks like for your infrastructure. Then expand monitoring as you identify what other metrics would be valuable. The best monitoring setup is one you’ll actually use and trust when it tells you something needs attention.