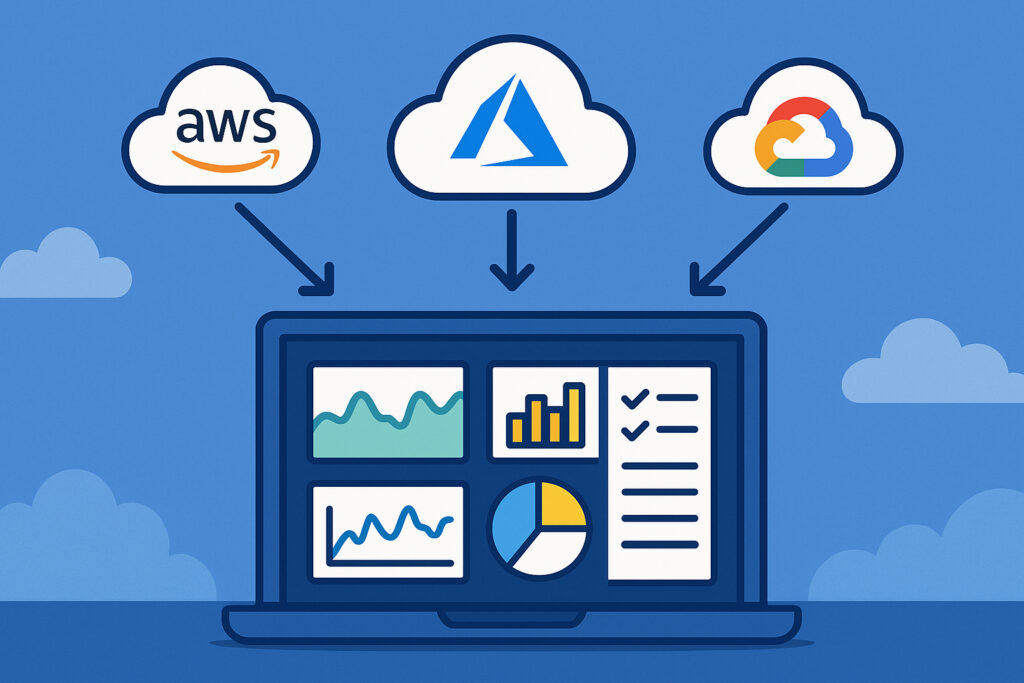
If you’re running infrastructure across multiple cloud providers, you already know the headache of juggling different monitoring dashboards. AWS CloudWatch has its metrics in one place, Azure Monitor shows you completely different data in another format, and Google Cloud’s operations suite uses yet another interface. I spent about three months last year trying to piece together a coherent picture of our multi-cloud setup, and honestly, it was a mess. You’d think the big cloud providers would make this easier, but they’re more interested in locking you into their ecosystem than helping you see across platforms.
Why Multi-Cloud Monitoring Matters
Most companies don’t start out planning a multi-cloud strategy. It just happens. Maybe you acquired another company that was already on Azure. Perhaps your development team insisted on using GCP’s machine learning tools while your production environment runs on AWS. Or you’re hedging your bets against vendor lock-in and price increases. Whatever the reason, once you’re spread across multiple clouds, you need a way to monitor everything without constantly switching between three different dashboards.
The real problem isn’t just inconvenience. When an incident happens, you need to see the full picture immediately. If your application spans AWS compute, Azure databases, and GCP storage, troubleshooting means correlating metrics across all three platforms. That’s nearly impossible when each provider shows you data in different formats with different time granularities.
Understanding What Each Cloud Provider Offers
AWS CloudWatch is probably the most mature of the three. It collects metrics from EC2 instances, RDS databases, Lambda functions, and pretty much every AWS service. The basic metrics come automatically, but detailed monitoring costs extra. CloudWatch also handles logs and can trigger alarms based on metric thresholds. The interface works well if you’re only in AWS, but it doesn’t know anything about your other cloud resources.
Azure Monitor pulls together data from Azure resources, applications, and even on-premises infrastructure if you set it up. It combines metrics, logs, and traces into what Microsoft calls ”full-stack monitoring.” The Application Insights component is particularly good for tracking web applications. Like CloudWatch, it’s designed primarily for Microsoft’s ecosystem.
Google Cloud Operations (formerly Stackdriver) focuses heavily on observability and debugging. It includes monitoring, logging, tracing, and profiling tools. GCP’s approach tends to be more developer-friendly, with better integration for containerized workloads and Kubernetes. But again, it’s optimized for Google’s services.
The Integration Challenge
Here’s where things get complicated. Each cloud provider uses different APIs, different authentication methods, and different data formats. AWS uses IAM roles and access keys. Azure relies on service principals and managed identities. GCP has its own service account system. Just getting authenticated to pull metrics from all three is a project in itself.
Then there’s the data format problem. AWS might report CPU usage as a percentage with one-minute granularity. Azure could show the same metric but calculated differently and available at five-minute intervals. GCP presents it in yet another format. If you’re trying to compare performance across clouds or set up unified alerting, you need to normalize all this data somehow.
Setting Up Cross-Cloud Monitoring
The most practical approach I’ve found is using a unified monitoring platform that integrates with all three cloud providers. You’ll need to set up proper authentication for each cloud first.
For AWS integration, create an IAM role with read-only access to CloudWatch metrics. The role needs permissions like cloudwatch:GetMetricData, cloudwatch:ListMetrics, and ec2:DescribeInstances. Generate access keys if your monitoring platform runs outside AWS, but IAM roles are more secure if you can use them.
For Azure integration, register an application in Azure Active Directory and create a service principal. Assign it the Monitoring Reader role at the subscription level. You’ll need the tenant ID, client ID, and client secret for authentication. Azure’s role-based access control is actually pretty clean once you understand the model.
For GCP integration, create a service account with the Monitoring Viewer role. Download the JSON key file, which contains all the authentication credentials. Keep this file secure because it provides access to your GCP metrics.
What Metrics Actually Matter
Don’t try to monitor everything at once. Start with the basics that affect your users: response times, error rates, and availability. Then add infrastructure metrics like CPU, memory, disk I/O, and network throughput. Database performance metrics come next, especially query execution times and connection pool usage.
I made the mistake early on of enabling every possible metric because I thought more data meant better visibility. It didn’t. It meant more noise and higher costs. Focus on metrics that actually indicate problems or help you make decisions.
Dealing With Multiple Metric Formats
Each cloud provider has quirks in how they present data. AWS aggregates metrics using statistics like Average, Sum, Maximum, and Minimum. Azure uses similar concepts but names them differently. GCP tends to provide more raw data points.
You need to standardize this somehow. Most unified monitoring platforms handle the conversion automatically, but verify that the transformations make sense. A five-minute average from Azure and a one-minute maximum from AWS aren’t directly comparable.
Setting Up Meaningful Alerts
Cross-cloud alerting is where unified monitoring really pays off. Instead of configuring alerts separately in CloudWatch, Azure Monitor, and GCP Operations, you set them up once in your monitoring platform.
The trick is making alerts contextual. High CPU usage on an AWS batch processing instance might be normal, while the same metric on an Azure web server could indicate problems. Tag your resources consistently across clouds so you can create targeted alerts based on environment, function, or criticality.
Cost Considerations
Cloud monitoring isn’t free, and costs can surprise you. AWS charges for custom metrics, detailed monitoring, and API calls. Azure Monitor has complex pricing based on data ingestion and retention. GCP charges for monitoring API calls beyond the free tier.
A unified monitoring platform adds another cost layer, but it often saves money by reducing the detailed monitoring you need to enable in each cloud. Instead of storing high-resolution metrics in all three clouds, you can pull them once and store them in your monitoring system.
Common Pitfalls to Avoid
The biggest mistake is assuming metrics mean the same thing across clouds. ”Available memory” in AWS EC2 might include cache, while Azure’s calculation excludes it. Always verify what each metric actually measures.
Another trap is ignoring network costs. If your monitoring platform runs in AWS but pulls metrics from Azure and GCP, you’ll pay for cross-cloud data transfer. Consider where your monitoring infrastructure lives in relation to what it’s monitoring.
Don’t forget about API rate limits either. Each cloud provider limits how quickly you can query their monitoring APIs. If you’re polling too frequently, you’ll hit limits or rack up unnecessary costs.
Making It Work Long-Term
Multi-cloud monitoring requires ongoing maintenance. Cloud providers constantly add new services and change existing ones. Your monitoring setup needs to evolve with them.
Document your integration configurations, especially the authentication setup. When someone leaves your team or security credentials need rotation, you’ll be glad you wrote down how everything connects. Also establish clear ownership for monitoring configuration so it doesn’t become neglected legacy infrastructure.
The goal isn’t perfection from day one. Start with basic metrics across all your clouds, get alerting working reliably, then gradually add more sophisticated monitoring as you learn what matters most for your specific infrastructure.