Budget-friendly monitoring for growing startups isn’t about cutting corners – it’s about spending smart when every dollar matters. If you’re running a startup that’s scaling fast, you need infrastructure visibility without blowing your runway on enterprise monitoring contracts. This article covers how to build a monitoring stack that grows with you, what to watch out for, and where free tools actually deliver.
The Startup Monitoring Problem
You’ve got three servers, a managed database, and a Kubernetes cluster you set up last weekend. Traffic is climbing. Your co-founder just asked “how do we know if something breaks at 3 AM?” and the honest answer right now is “we don’t.”
This is the phase where most startups make one of two mistakes. They either ignore monitoring entirely and hope for the best, or they sign up for an enterprise platform that costs more per month than their cloud bill. Both paths end badly – one with unexpected outages, the other with budget meetings that make everyone uncomfortable.
The sweet spot is a monitoring setup that covers the essentials from day one and scales as your infrastructure grows. You don’t need 200 integrations when you have 5 servers. You need to know when CPU is spiking, when disk is filling up, and when your API stops responding.
What a Startup Actually Needs to Monitor
Forget the feature comparison spreadsheets for a moment. Here’s what actually matters when you’re small and growing:
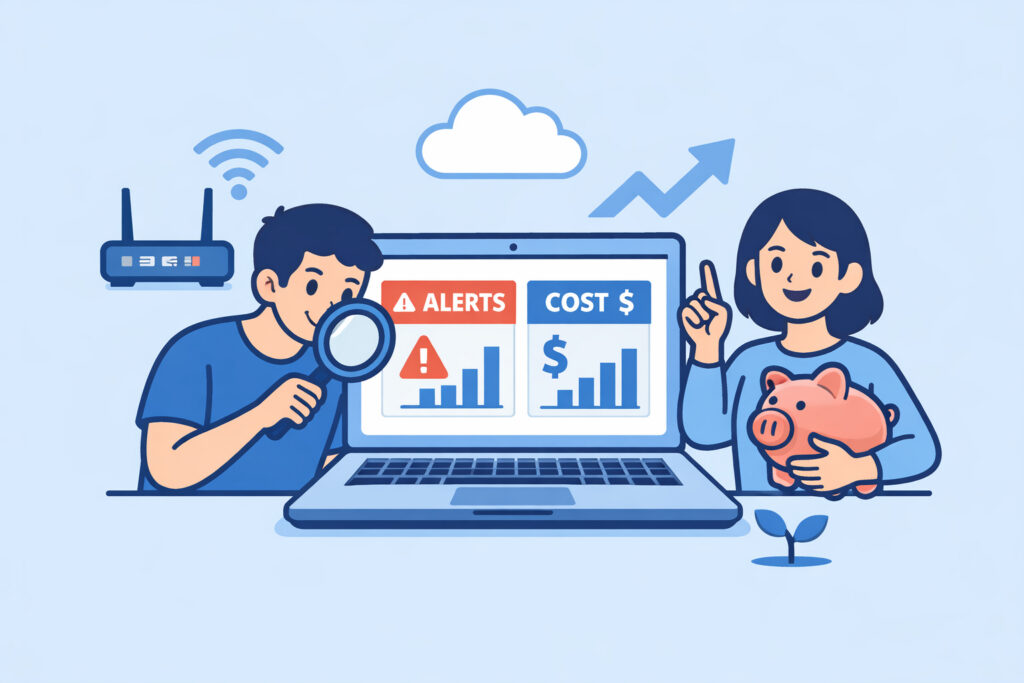
Server health basics. CPU, memory, and disk usage across every machine. This catches 80% of issues before they become incidents. A single dashboard showing real-time CPU, memory, and disk metrics is worth more than a dozen advanced features you’ll configure “someday.”
Uptime and endpoint checks. External pings that confirm your app is reachable. Internal metrics mean nothing if your load balancer is misconfigured and nobody can reach the site.
Alerts that actually fire. A monitoring tool without alerts is just a pretty graph. You need notifications when thresholds are crossed – not a dashboard someone has to remember to check.
Process and service monitoring. Knowing that your Node app crashed and didn’t restart is the difference between a 2-minute blip and a 4-hour outage that a customer reports.
That’s it for the first stage. Database metrics, SNMP, cloud integrations – those come later when your infrastructure justifies them.
Busting the “Free Means Unreliable” Myth
There’s a persistent myth in startup circles that free monitoring tools are toys – fine for hobby projects, useless for production. This was arguably true a decade ago. It’s not true now.
Modern free-tier monitoring platforms offer agent-based metrics, external checks, and alerting that would have cost thousands annually five years back. NetworkVigil’s free tier, for instance, includes full agent metrics alongside external uptime, port, and SSL monitoring. You’re not getting a crippled demo – you’re getting a functional monitoring stack.
The real question isn’t “is it free?” but “does it cover what I need right now, and can I upgrade without migrating?” That’s the budget-friendly approach: start free, pay only when you genuinely need premium features like SNMP device monitoring or cloud integrations.
Building Your Monitoring Stack Step by Step
Here’s a practical path that works for startups going from 2 servers to 20:
Week 1: Install agents on everything. Get a lightweight agent running on every server and VM. This should take minutes per machine, not hours. If your monitoring tool requires a dedicated monitoring server just to get started, it’s the wrong tool for this stage.
Week 2: Set up alerts for the obvious stuff. Disk usage above 85%. CPU sustained above 90% for 5 minutes. Memory usage above 90%. Any service on your critical path going down. Start with email or Slack notifications – don’t overthink the escalation chain when your team is four people.
Week 3: Add external checks. Configure uptime monitoring for your public endpoints. Add SSL certificate expiry alerts so you don’t get caught by a forgotten renewal. These checks should run from outside your network – internal monitoring alone creates a blind spot.
Month 2 onward: Expand as needed. Add database monitoring when your queries start getting slow. Set up a multi-server dashboard when you cross 5–10 machines and individual server views become impractical. Consider cloud integrations when your AWS bill starts surprising you.
What Not to Spend Money On Yet
Startups love shiny tools. Here’s what you can safely skip in the early stages:
Full APM suites. Application Performance Monitoring is valuable, but at $20–50 per host per month, it adds up fast. Basic server and uptime monitoring catches most issues. Add APM when you have specific performance problems to diagnose.
Log aggregation platforms. Centralized logging matters at scale. At 3 servers, SSH and grep work fine. Save the Elastic cluster for when you actually can’t find what you need.
Custom dashboards on day one. Use the defaults. Customize when you know what you’re actually looking at every day versus what looked cool during setup.
Annual enterprise contracts. Never lock into a 12-month monitoring contract at the startup stage. Your infrastructure in 6 months will look nothing like it does today. Use tools that let you scale month-to-month or stay on free tiers as long as they fit.
The Real Cost of No Monitoring
A quick calculation most founders skip: if your SaaS product makes $10,000/month and you average one undetected outage per quarter lasting 4 hours, that’s roughly $55 in direct lost revenue each time – not catastrophic. But the customer trust damage is the real cost. Three enterprise prospects who hit your app during downtime and never come back could represent $50,000+ in lost annual revenue. A free monitoring agent that catches the problem in 60 seconds instead of 4 hours pays for itself before it costs anything.
Frequently Asked Questions
How many servers can I monitor on a free plan before I need to upgrade?
This varies by platform, but modern free tiers are genuinely usable for small teams. NetworkVigil’s free tier includes agent-based monitoring with full metrics and external checks. Most startups can run comfortably on a free plan through their first 5–10 servers. Evaluate premium features when you need SNMP polling, cloud provider integrations, or advanced custom dashboards – not before.
Should a startup use open-source monitoring tools instead?
Open-source tools like Prometheus and Grafana are powerful but require setup, maintenance, and expertise. If you have a dedicated DevOps engineer who enjoys that work, go for it. If your team is three developers shipping product, a managed monitoring platform – even a free one – saves hours per month that are better spent building features.
When is the right time for a startup to start paying for monitoring?
When the free tier genuinely limits your ability to detect or respond to incidents. Common triggers are needing multi-cloud visibility, SNMP for network hardware, or SLA tracking for customer contracts. If the free plan still covers your infrastructure and alerting needs, there’s no reason to upgrade just because your company raised a Series A.
The most budget-friendly monitoring decision a startup can make is starting early and starting free. An agent installed today catches the outage that would have cost you a customer tomorrow. Scale your monitoring spend with your infrastructure – not ahead of it, and definitely not behind it.