If you’re running applications that your business depends on, you already know the feeling. It’s Friday evening, you’re finally relaxing, and then your phone buzzes. A customer can’t reach your app. You check — the database server ran out of disk space two hours ago, and nobody noticed until users started complaining. That’s exactly the kind of scenario proper service status monitoring prevents.
Whether you’re a solo sysadmin managing a handful of servers or part of a DevOps team responsible for dozens of microservices, monitoring isn’t optional anymore. It’s the difference between catching problems before they escalate and scrambling to fix outages at 2 AM. Let me walk you through what service status monitoring actually involves, how to set it up effectively, and what mistakes to avoid along the way.
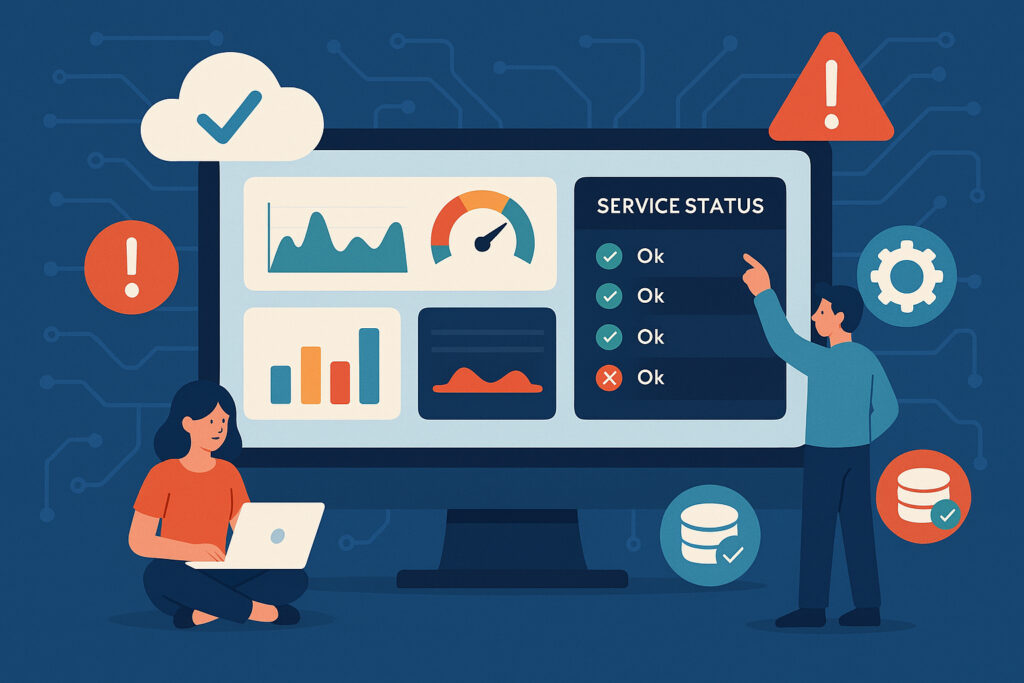
Why Service Status Monitoring Matters More Than You Think
Most people think monitoring means checking if a server is up or down. That’s only a fraction of the picture. True service status monitoring tracks whether your applications are actually functioning correctly from the user’s perspective. A web server might respond to a ping just fine while the application behind it is throwing 500 errors on every request.
Critical applications — payment processing, customer portals, internal ERP systems, healthcare platforms — need more than basic uptime checks. You need to know that the service is responding within acceptable time frames, that backend dependencies like databases and APIs are healthy, and that resource consumption isn’t creeping toward dangerous thresholds.
I learned this the hard way a few years back. We had monitoring on our main web servers, and everything looked green. Meanwhile, a background job queue had silently stopped processing. It took almost a full business day before anyone realized that order confirmations weren’t being sent. The servers were up, the website loaded fine, but a critical service behind the scenes had failed. That incident changed how I approach monitoring entirely.
What You Should Actually Monitor
When setting up monitoring for critical applications, think in layers. Start from the outside and work your way in.
External availability is the first layer. Can users reach your service? This means HTTP checks, port monitoring, and SSL certificate validity. If your SSL cert expires unexpectedly, browsers will block your users before they even get to your app.
Application health is the second layer. Are your services responding correctly? This goes beyond a simple ping. You want to check actual endpoints, verify response codes, and measure response times. A page that takes 15 seconds to load is technically “up” but effectively broken.
Infrastructure metrics form the third layer. CPU usage, memory consumption, disk space, and network throughput on your servers. These are the early warning signs. If disk usage hits 90%, you have hours or days to fix it. If it hits 100%, you have an outage.
Dependency monitoring is the layer most people forget. Your application probably relies on a database, a cache layer like Redis, maybe an external API or two. Each of those is a potential point of failure, and each needs its own checks.
Setting Up Monitoring Step by Step
Start simple and expand. Trying to monitor everything on day one leads to alert fatigue and abandoned dashboards.
First, identify your critical services. Make a list of every application and dependency that, if it failed, would directly impact users or revenue. Be honest — not everything is critical, and pretending it is dilutes your focus.
Second, set up external checks for those services. Uptime monitoring, port checks, and SSL monitoring should be your baseline. Tools like NetworkVigil let you configure these without installing anything on your servers, which means you get coverage immediately.
Third, deploy a lightweight agent on your servers for infrastructure metrics. You want CPU, memory, disk, and network data flowing into a central dashboard. The key word here is lightweight — your monitoring agent shouldn’t itself become a resource problem.
Fourth, configure meaningful alerts. This is where most setups go wrong. You don’t need an alert every time CPU spikes to 80% for ten seconds. Set thresholds that reflect actual risk. Disk at 85% for more than 30 minutes? That’s worth a notification. A brief CPU spike during a deployment? Probably not.
Fifth, establish escalation paths. If the first alert goes unacknowledged for 15 minutes, it should escalate. Monitoring without response procedures is just logging with extra steps.
Common Mistakes That Undermine Your Monitoring
Alert fatigue is the biggest killer. If your team gets 50 alerts a day and most of them are noise, they’ll start ignoring all of them. Be ruthless about tuning thresholds and suppressing non-critical notifications.
Monitoring only from one location gives you a false sense of security. Your server might be perfectly reachable from your office network but unreachable from another continent due to a routing issue.
Forgetting to monitor the monitor sounds silly, but it happens. If your monitoring platform itself goes down, you’re flying blind. Make sure you have at least a basic secondary check — even a simple external ping service — watching your primary monitoring setup.
Ignoring SLA tracking is another common gap. If you promise 99.9% uptime to customers, you need to actually measure it. That’s roughly 8.7 hours of allowed downtime per year. Without proper tracking, you won’t know whether you’re meeting that commitment until a customer disputes their invoice.
Frequently Asked Questions
Do I need to pay for monitoring? Not necessarily. Platforms like NetworkVigil offer comprehensive free tiers that include external monitoring and full agent-based metrics. You can monitor infrastructure effectively without spending anything. Premium features like SNMP device monitoring or cloud integrations are there when you need them, but most teams can start for free.
How often should checks run? For critical services, every 60 seconds is a reasonable starting point. For less critical systems, every 5 minutes is usually sufficient. More frequent checks give you faster detection but generate more data.
What’s the difference between monitoring and observability? Monitoring tells you when something is wrong. Observability helps you understand why. Monitoring is your first priority — you need to know about problems before you can diagnose them. Observability comes next as your setup matures.
Can I monitor databases too? Absolutely. Query performance, connection pool usage, replication lag, and table sizes are all worth tracking. A slow database query can cascade into application-wide slowdowns faster than almost any other issue.
Start Where You Are
You don’t need a perfect monitoring setup on day one. Start with the basics — uptime checks, SSL monitoring, and server resource tracking for your most critical applications. Get comfortable with your dashboards and alert workflows. Then expand coverage to secondary services, add database monitoring, and refine your thresholds based on what you learn.
The goal isn’t to monitor everything. It’s to make sure you always know the status of the services that matter most, before your users tell you something is wrong.